Fear of Missing Out: Buying when prices rise
| # | Name | Performance 7 days | bought in this wikifolio, among others |
| 1 | 11.72% | Investment 4.0 | |
| 2 | 6.42% | Trendfollowing Deutschland | |
| 3 | 6.58% | Aktienfuxx | |
| 4 | 11.76% | Responsible Investing | |
| 5 | 24.50% | valuable resource royalty mining |
FOMO hit wikifolio traders last week in connection with US IT security company - ’ stocks. Their stock rose by 10.9 % week-on-week, after the company presented its figures for the previous quarter. Revenue per share clearly exceeded analysts' expectations of USD 0.78, reaching a value of USD 1.05.
According to aktien.guide data, Palo Alto Networks' EV/Sales ratio (enterprise value/sales for the last 12 months) is currently at 9.27. The enterprise value (market capitalisation - cash + debt) is currently at USD 57.08 billion. The chart below shows the EV/Sales ratio of the company over the last few years.
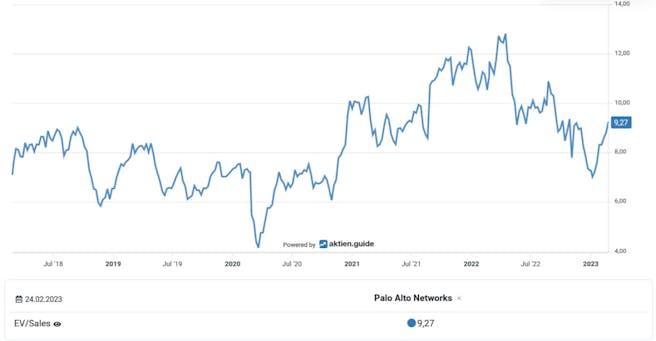
The enterprise value/sales ratio (EV/sales) puts the "true" enterprise value in relation to sales or revenue. This is an important ratio for assessing the valuation of a company's stocks.
Buying the Dip: Buys when prices fall
| # | Name | Performance 7 days | bought in this wikifolio, among others |
| 1 | -6.65% | 7daysafter | |
| 2 | -5.22% | 25 Jahre Börsenerfahrung | |
| 3 | -7.09% | Tenbagger - Sei aufmerksam | |
| 4 | -6.71% | Largecap Dividende Burggraben | |
| 5 | -6.63% | PEYOS Beste |
Last week, wikifolio traders bet on the "dip" - i.e. the imminent reversal of the trend – concerning stocks. The share price of this server provider fell by 6.9 % week-on-week. However, the initial rebound which started at the beginning of the year is still in full swing and, compared with the previous month, its share price has risen by 24.4 %.
wikifolio traders have great confidence in Cloudflare. In the last six months, Buys have exceeded Sells by 76 %. In comparison, Buys and Sells of an average Nasdaq stock (54 % Buys / 46 % Sells) almost balanced each other out over the same period.
A look at the chart below shows why this stock is so popular at the moment and why decreases in the share price are used as buying opportunities. The stock (blue line) is a good 70% away from its all-time highs. However, unlike many other tech stocks, the company's sales growth (red line) only declined slightly. Year-on-year, it still stands at 48.57 %, according to aktien.guide.
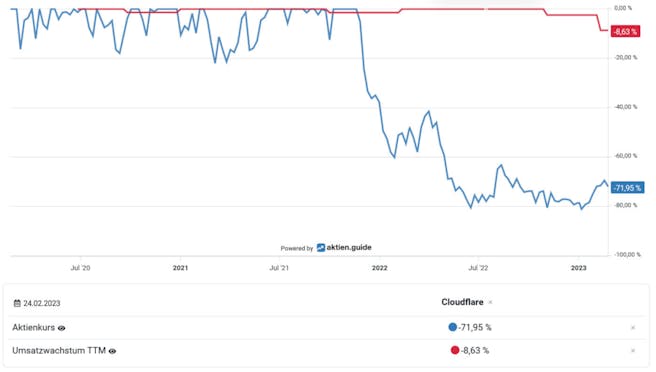
The ‘below-the-waterline’ format shows (as a percentage) the difference between the share price and the all-time high over the specified period.
Taking Profit: Selling when prices are rising
| # | Name | Performance 7 days | sold in this wikifolio, among others |
| 1 | 10.57% | Anlegerliebling | |
| 2 | 5.87% | Ambition Europa und USA | |
| 3 | 21.72% | Globale Herausforderungen 4.0 | |
| 4 | 5.39% | Refresh | |
| 5 | 6.13% | All In One ***TOP-WERTE*** |
Last week, wikifolio traders saw profits on . A look at the chart reveals why: since the beginning of the year, the chip manufacturer's stocks have performed at around 60 %. The main driving forces behind this recent rally have been the general recovery of tech stocks, the hype around ChatGPT and, most recently, the company's quarterly figures, which exceeded analysts' expectations.
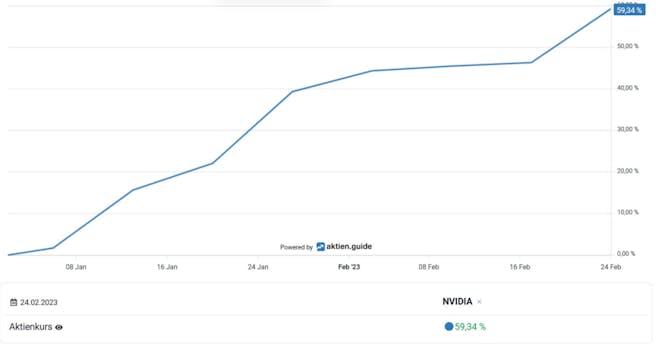
YTD performance of Nvidia according to aktien.guide
Jumping the Ship: Selling when prices are falling
| # | Name | Performance 7 days | sold in this wikifolio, among others |
| 1 | -10.86% | Tradingchancen dt. Nebenwerte | |
| 2 | -9.00% | Börsenclub | |
| 3 | -7.28% | Tradingchancen dt. Nebenwerte | |
| 4 | -13.08% | 25 Jahre Börsenerfahrung | |
| 5 | -15.16% | Relative Stärke Dow-Nasdaq-Werte |
Selling while prices are falling could be seen last week in relation to German chip industry supplier . The company's share price slumped by around 10% week-on-week, following the publication of a surprisingly disappointing sales forecast. wikifolio trader Christian Mallek (SIGAVEST) explains: "Siltronic is significantly reducing its sales and profit forecast for 2023. Postponements of customer orders as well as write-offs on inventories make this necessary. Margins are predicted to fall to 30-33%." Mallek's conclusion: "We’re playing it safe and selling."
Top trade of the week: + 343.5 %
One of the top trades of the week was achieved by Kai Knobloch (Halbprofi87) on 23.02. In his wikifolio Trend & Fundamental he sold shares with a profit of 343.5 %. The shares he sold accounted for 0.4 % of the total portfolio. Knobloch first added the chip manufacturer's stock to his wikifolio in 2016.
Chart
Disclaimer: Every investment in securities and other forms of investment is subject to various risks. Explicit reference is made to the risk factors in the prospectus documents of Lang & Schwarz Aktiengesellschaft (Final Terms, Base Prospectus together with supplements and the Simplified Prospectuses, respectively) at wikifolio.com , ls-tc.de and ls-d.ch. You should read the prospectus before making any investment decision in order to fully understand the potential risks and rewards of the decision to invest in the securities. The approval of the prospectus by the competent authority should not be construed as an endorsement of the securities offered or admitted to trading on a regulated market. The performance of the wikifolios as well as the respective wikifolio certificates refers to past performance. Future performance cannot be inferred from this. The content of this site does not constitute investment advice or a solicitation to buy or sell securities. This applies in particular to countries in which such an offer to buy or sell is not permitted. For further information, please refer to our General Terms and Conditions.

